
Last Update:
Reading Time:
1. Data is Forgetful
Many of us have moments when we revisit a graph weeks later and say “What had happened here?”
Actually, the data is always there, but we have long forgotten its context.
The annotation feature in GA4 precisely stops this forgetfulness at this point.
We can record a campaign behind a traffic spike or the reason for a drop in conversion by noting it in the system.
Three months later, someone looking at that graph will now move forward with the question “What happened?” replaced by “How can we proceed?”.
GA4 Application:
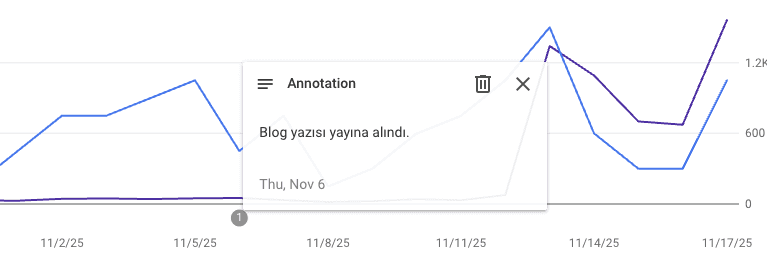
You can add date-based explanations to the graph via Admin > Property > Annotations.
A simple sentence like “A new landing page was launched.” will be sufficient for future recall.
Advanced Tip: By adding emoji codes or tag formats (e.g.: [Campaign], [Test]) to annotations, you can easily categorize them in search filters.
2. Do a Favor for Your Future Self and Leave a Note on the Graph
Today you launch a campaign, you look at that graph again six months later.
But in the meantime, dozens of tests, revisions, and budget changes have occurred…
In those very days, your future self would have greatly wished to receive a message from your past self:
“The increase here was the first day of the Meta campaign.”
These little notes are the easiest way to understand the data.
Advanced Tip: You can automatically reflect GA4 annotations into your visual reports by matching them with Data Studio (Looker Studio).
For example, it is possible to pull annotation texts from a Google Sheet and add them as tooltips below the graph.
3. Escaping the Correlation Traps
A conversion rate drops, one says “the site speed has decreased”, another says “user behavior changed”.
However, in reality, only the checkout pages have been redesigned.
Had this change been recorded as an annotation, no one would have generated random theories.
Annotations are the most practical way to filter out the “coincidence” from the data.
GA4 Application:
Add significant changes (e.g., new pricing, domain change, addition of cookie banner) as an annotation.
This way, “breakpoints” in trend analyses will be clarified.
4. Information Lost in Slack Can Live Forever in the Graph
“Do you remember, the server was moved that week?”
Yes, but that message has long been lost in Slack.
The biggest problem in analytical communication is the fragmentation of information.
GA4 annotations centralize the team’s memory.
GA4 Application:
Designate someone responsible for inputting annotations at the start of each campaign or website update.
This way, information sharing among teams becomes “culturized”.
5. Leaving a Silent Mentor for New Analysts
When a new person joins the team, it takes time to understand the past fluctuations.
But annotations in the graphs work like a silent mentor.
If campaigns, crises, and experiments are all explained with short notes, the onboarding process can even be data-driven.
GA4 Application:
Add brief but explanatory notes for every important event: “Variant B was activated in A/B testing.”
New analysts can read and learn the past from the data.
6. The Unsung Hero in Postmortem Meetings
After every campaign, discussions about “Why didn’t it meet the target?” take place.
But most of the time, no one remembers exactly what changed when.
Annotations clarify postmortem analyses.
By looking at the notes from that week, one can say “actually the budget was reduced” or “the landing page was changed”.
GA4 Application:
Add an annotation for every major decision or action.
Collect these notes at the end of quarters to include them in the retrospective report.
7. The Use of Automatic Annotations in GA4 (Pro Tip)
Manual annotations are nice, but they are prone to human error.
You can set up an automatic annotation system using the API, Google Sheets, or BigQuery.
For example:
A script that automatically notes in GA4 at the start of each campaign,
An integration that adds release dates from GitHub as annotations.
This way, the data itself tells both the past and the events.
8. Data Culture is Built with Small Habits
Inputting an annotation takes 30 seconds but saves years to the corporate memory.
Every data point becomes a part of a small story.
As this habit becomes widespread, reports convey not only numbers but also meaning.
GA4 Application:
Involve adding annotations in the campaign briefing process.
Each launch should start with a check, “Was a note submitted?”.
Advanced Tip: You can gamify the habit by rewarding the team with an “Annotation of the Week” prize.
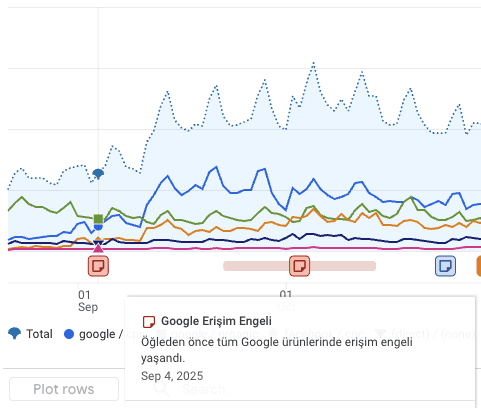
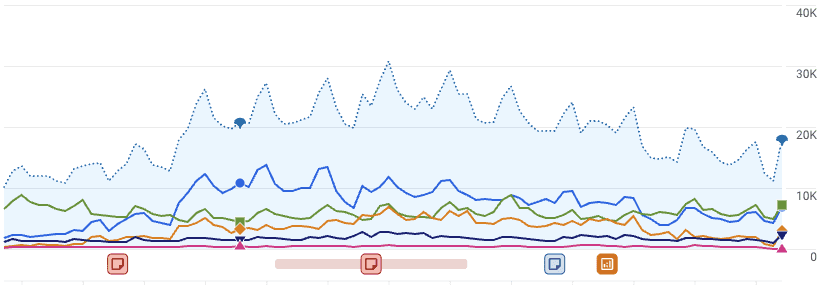
The New Annotation Feature in Search Console: A New Layer of Memory for SEO
The annotation approach we have long been familiar with on the GA4 side is now available in Google Search Console as well. This means that much clearer causal reading can be performed, especially in organic performance analyses.
Finding the source of fluctuations in SEO efforts is not always easy. Core updates, content updates, link structure changes, indexing issues, crawling budget behavior, spam attacks, or manual actions… Each of these leaves a mark on the graph, but when historical context is not recorded, the “hypothesis generation process” unnecessarily elongates.
With the note-adding feature in Search Console, you can precisely close this blind spot.
You can now add date-based explanations to the clicks, impressions, average position, and CTR graphs, thus recording the breakpoints in organic performance along with their reasons.
Search Console Annotation Application:
While in the graphical view of the performance or Search Results report, click on the relevant date range and use the “Add note” option.
For example: “New content published”, “Disavow file updated”, “Core update effect – wait and observe”
Advanced Tip:
By categorizing notes with tag formats like “Algorithm Update”, “Content Revision”, “Technical Improvement”, you can derive much faster analytical insights when filtering from graphs months later.
With this innovation, SEO analysis is no longer just a backward forecasting game but transforms into a historically evidence-based analysis practice.
GA4 and Google Search Console measure data but are silent. It is up to us to give them a voice.
Let’s not forget that only if we take notes can every graph tell a story.
Our Other Blog Posts


