
The Least Used But Most Powerful Feature in Analytics: Annotation
1. Data is Forgetful
Most of us have had moments where we looked back at a chart weeks later and asked, "What happened here?"
In fact, the data is always there, but we have long forgotten its context.
This is exactly where the annotation feature in GA4 stops this forgetfulness.
We can record the campaign behind a traffic spike or the reason for a drop in conversions by adding a note to the system.
Three months later, someone looking at that chart will proceed with the question, "How can we continue?" instead of "What happened?".
**GA4 Implementation:**You can add date-based explanations on the chart via the Admin > Property > Annotations path.
Even a simple sentence like "New landing page launched." will be enough to remember later.
Advanced Tip: You can easily group your annotations in search filters by adding emoji codes or tag formats (e.g., [Campaign], [Test]).
2. Do a Favor for Your Future Self and Drop a Note on the Chart
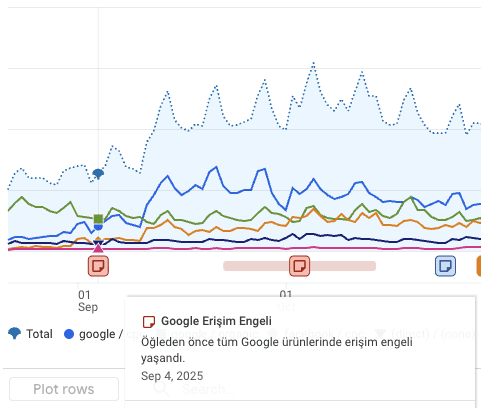
Today you launch a campaign, and 6 months later you look at that chart again.
But in the meantime, dozens of tests, revisions, and budget changes have happened…
Right in those days, your future self would love to receive a message from your past self:
"The increase here was the first day of the Meta campaign."
These small notes are the easiest way to make sense of the data.
Advanced Tip: By matching GA4 annotations with Data Studio (Looker Studio), you can automatically reflect notes onto your visual reports.
For example, it is possible to pull annotation texts from a Google Sheet and add them as tooltips underneath the chart.
3. Escaping Correlation Traps
A conversion rate drops, someone says "site speed decreased", another says "user behavior changed".
Yet in reality, checkout pages were simply redesigned.
If this change had been recorded as an annotation, no one would be making random theories.
Annotations are the most practical way to filter out "coincidences" from the data.
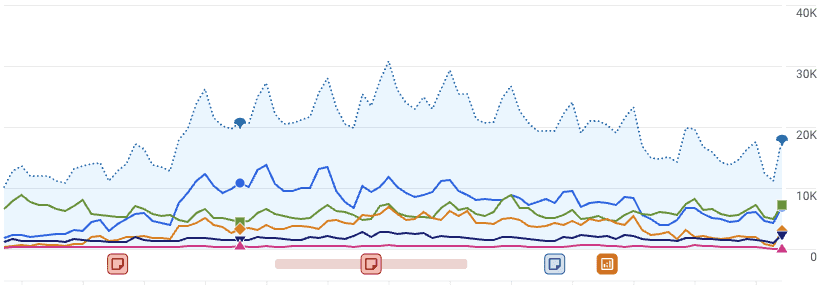
**GA4 Implementation:**Add major changes (such as new pricing, domain changes, adding a cookie banner) as an annotation.
This way, "breaking points" are explained in trend analyses.
4. Lost Info in Slack Can Live Forever in the Chart
"Do you remember, the server was migrated that week?"
Yes, but that message is already lost in Slack.
The biggest problem in analytical communication is the fragmentation of information.
GA4 annotations centralize team memory.
**GA4 Implementation:**Have one person responsible for entering an annotation at the start of every campaign or site update.
This way, sharing knowledge between teams becomes "culturalized."
5. Leaving a Silent Mentor for New Analysts
When someone new joins the team, it takes time for them to understand past fluctuations.
But annotations on the charts work like a silent mentor.
If campaigns, crises, and experiments are all described with short notes, even the onboarding process can be done through data.
**GA4 Implementation:**Add short but descriptive notes for every important event: *“Variant B deployed in A/B test.”*New analysts can read and learn about the past directly from the data.
6. The Unsung Hero of Postmortem Meetings
After every campaign, discussions are held asking, "Why didn't we hit the target?"
But most of the time, no one remembers exactly what changed and when.
Annotations provide clarity in postmortem analyses.
By looking at the notes for that week, one can say "actually, the budget was reduced" or "the landing page changed".
**GA4 Implementation:**Add an annotation for every major decision or action.
Collect these notes at the end of quarters to include them in the retrospective report.
7. Automated Annotation Usage in GA4 (Pro Tip)
Manual annotations are nice, but they are prone to human error.
You can build an automated annotation system using an API, Google Sheets, or BigQuery.
For example:
-
A script that automatically drops a note to GA4 at the start of every campaign,
-
An integration that adds release dates from GitHub as annotations.
This way, data tells the story of both the past and the events by itself.
8. Data Culture is Built Upon Small Habits
Entering an annotation takes 30 seconds but saves years of institutional memory.
Every data point becomes part of a little story.
As this habit spreads, reports carry meaning, not just numbers.
**GA4 Implementation:**Integrate adding annotations into the campaign brief process.
Let every launch begin with the check "Has the note been entered?"
Advanced Tip: You can gamify the habit by giving the team an "Annotation of the Week" award.
The Annotation Feature Coming to Search Console: A New Memory Layer for SEO
The annotation approach that we have long been used to in GA4 is now available in Google Search Console as well. This means that a much clearer reading of causality can be done, especially in organic performance analyses.
Finding the source of fluctuations in SEO efforts is not always easy. Core updates, content updates, link structure changes, indexation issues, crawl budget behavior, spam attacks, or manual actions... Each of these leaves a trace on the chart, but when historical context is not recorded, the "hypothesis generation process" takes unnecessarily long.
You can close this exact blind spot with the note-taking feature inside Search Console.
Now, you can add date-based explanations on clicks, impressions, average position, and CTR charts, thereby recording the breaking points in organic performance along with their reasons.
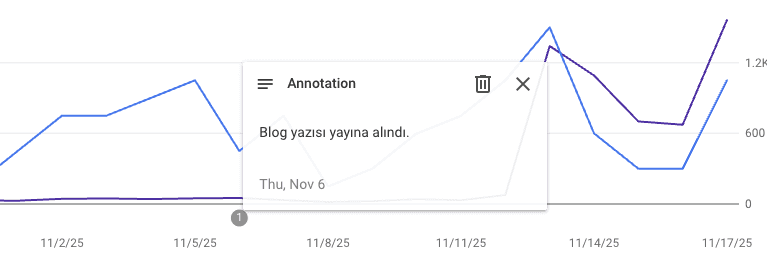
Search Console Annotation Implementation:
-
While in the chart view of the Performance or Search Results report, click on the relevant date range and select the “Add note” option.
-
For example: “New content launched”, “Disavow file updated”, “Core update effect – wait and observe”
Advanced Tip:
By categorizing notes with tag formats such as “Algorithm Update”, “Content Revision”, “Technical Improvement”, you can extract analytical insights much faster when filtering months later from the charts.
With this innovation, SEO analysis is no longer just a retrospective guessing game, but turns into an analysis practice based on historical evidence.
GA4 and Google Search Console measure data, but they are quiet. It is up to us to give them a voice.
Let’s not forget that only if we take notes can every chart tell a story.
More Posts
All posts →
Bir Butonun Rengini Değiştirmek Gerçekten Satışı Artırır mı?
Kırmızı butonların dönüşüm oranını artırdığı iddiası bir efsane mi? HubSpot’un ünlü A/B testinin ardındaki gerçek kontrastı ve CTA rengi seçim rehberini keşfedin.
Read more →
Milisaniyeler Milyonlara Mal Olur: Google/Deloitte Hız Araştırması Işığında Site Hızı–Dönüşüm Bağlantısının Yol Haritası
Deloitte'un Google için yürüttüğü araştırmaya göre mobil sitenizi sadece bu kadar hızlandırmak, perakendede dönüşümü yüzde sekizden fazla artırıyor. Göz kırpması kadar bir süre; ciroda milyonlar.
Read more →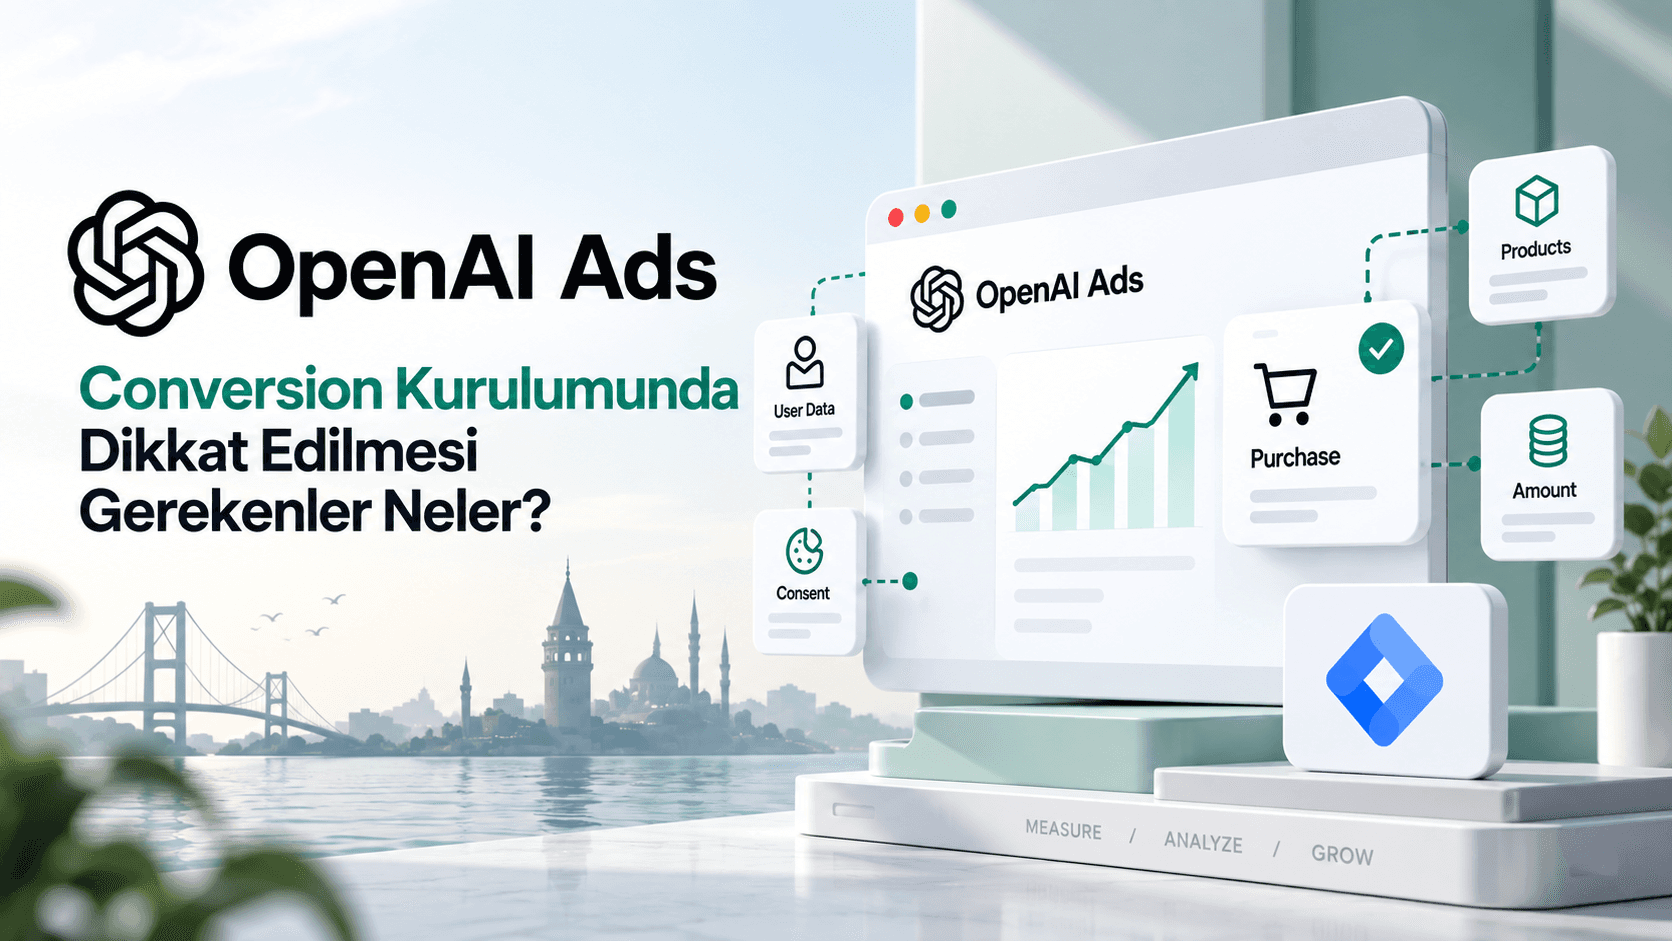
OpenAI (ChatGPT) Ads Conversion Kurulumunda Dikkat Edilmesi Gerekenler Neler
ChatGPT reklamları artık Türkiye'de de yayında ve e-ticaret siteleri conversion takibini kurmaya başladı. Google Tag Manager üzerinden resmi OpenAI template'i ya da Stape'in template'i ile kurulum kağıt üzerinde basit görünüyor.
Read more →Ready to grow together?
Let's talk about your goals and build the right plan together.