
Same Creative, Different Results: Measure by Placement and Manage Automatically with Ad Venture One
A creative may drive sales in Reels while wasting your budget in the Facebook feed. The account average won’t show you this. With Ad Venture One, see what each creative delivers in each placement, shift budget to the winners and hand the job to the autopilot.
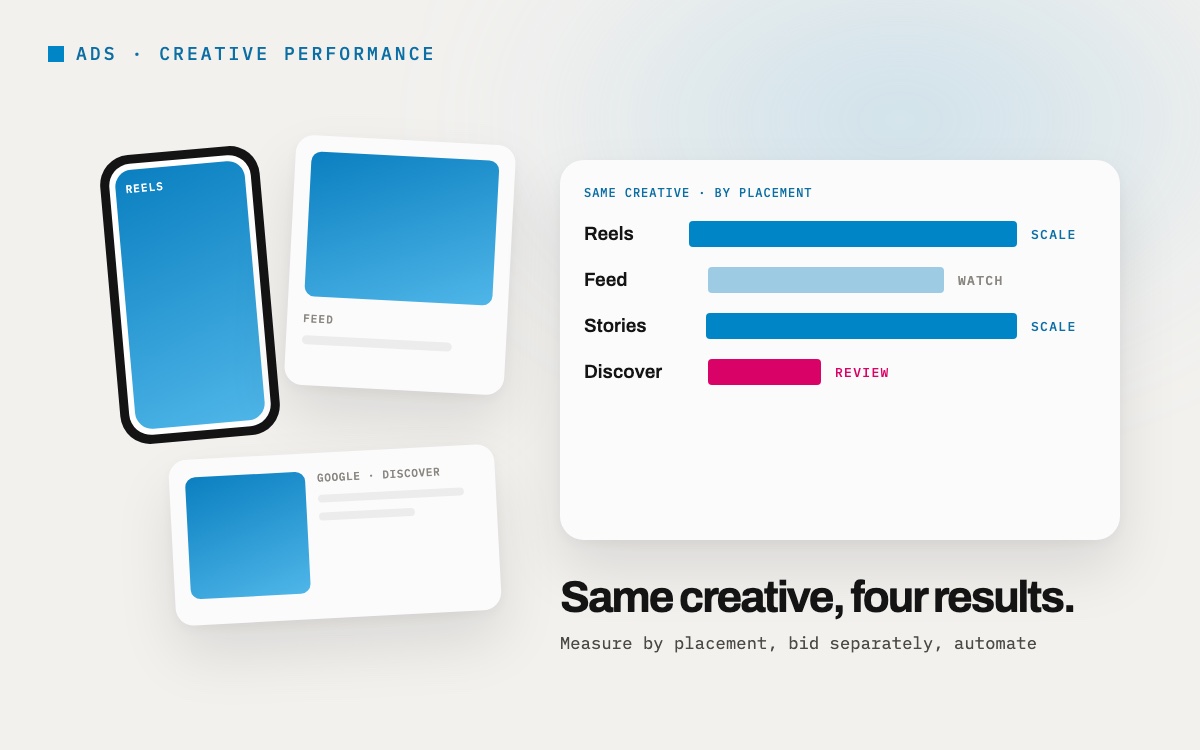
One of the sentences we hear most often in ad accounts is: “This creative is working really well.” But where? In Meta’s Reels placement, the Facebook feed or Stories? On the Google side, in Performance Max’s YouTube inventory, Discover or Gmail? A creative being “good” usually means it is good in a particular placement. Look at the account average and that difference disappears, and the budget keeps being distributed without seeing it.
At Ad Venture Digital, we ask this question every day in the accounts we manage. In this post we answer three questions: Is it possible to report creative performance by placement on Meta and Google? How do you bid differently with this information? And can we automate this instead of doing it by hand every day?
Same creative, different stages
Every placement has its own viewing habits. Reels and Stories are vertical, full screen and watched with sound; a creative that fails to grab attention in the first second or two gets swiped away. In feed placements users move more slowly and read text and product details more closely. In Google’s YouTube inventory video and motion stand out, while in Discover and Gmail what matters is how clearly the image reads inside a “card”.
That is why the same creative can produce very different click-through rates, conversion rates and costs per conversion depending on placement. A creative that looks “average” in the account average may in fact be a star in one placement and a budget drain in another.
Reporting by placement on Meta
In Meta Ads Manager, you can split ad-level results by placement using the “Breakdown” menu. This lets you see each creative’s spend, results and cost separately for the Facebook feed, Instagram feed, Reels, Stories and other placements. There are two things to keep in mind:
- Breakdown data shows where the spend went; if Advantage+ placements are on, the system already shifts budget to where it expects the cheapest results. So low spend in a placement does not always mean “poor performance”.
- Breakdowns with small spend can be misleading. Before making a decision, make sure a meaningful volume of spend and conversions has built up per placement.
Reporting by asset and channel on Google
On the Google side the picture is a little different. In Performance Max and Demand Gen campaigns, images work as “assets”; Google shows them in different combinations across different inventory. Asset reports show how each image performs, while channel reports show how the budget is split between YouTube, Display, Search, Discover and Gmail. Reading these two reports side by side gives you a strong idea of which creative stands out in which type of inventory.
So can you bid differently?
Short answer: yes, but where the platform allows it. Neither Meta nor Google has a button that lets you tell a single creative “bid this much in that placement”. Instead, you design the structure:
- Separating placements on Meta: You can move creatives that stand out in a particular placement into an ad set dedicated to that placement and manage it separately with a cost cap or bid cap. For example, a more aggressive cost target for vertical videos that are strong in Reels, and a more cautious one for creatives that are weak in the feed.
- Asset customization by placement: Defining vertical images for Stories and Reels and square images for the feed in the same ad ensures each placement shows the best creative in its own format.
- Campaign and asset group structure on Google: Grouping strong creatives in separate asset groups, replacing weak ones and differentiating target ROAS or target CPA values at campaign level; using value rules to assign higher value to specific signals.
- Shifting budget to the winners: Very often the strongest “bid” move is not changing the bid but shifting budget to the winning creative and placement combinations.
What does this give you?
- You win back wasted budget. In most accounts, spend on creatives that deliver far below average but are still live continues unnoticed for months.
- You grow the winners in the right place. Knowing which placement a creative is strong in lets you scale based on evidence rather than blindly.
- You give the creative team a clear brief. Instead of “a better creative”, you define a concrete need such as “a vertical video for Reels with a strong first two seconds”.
- You catch fatigue early. A creative’s performance first starts to drop in a particular placement; the placement breakdown shows this signal much earlier than the account average.
Why doing it by hand is not sustainable
Doing this analysis once is not hard. What is hard is doing it every day across dozens of campaigns, hundreds of creatives and two separate platforms. Exporting breakdowns, combining them, comparing them with the same definitions and then applying each change on the platforms one by one takes hours. And for decisions to be consistent, you need to apply the same rules every time: at what threshold is a creative considered “fatigued”? How much spend must build up before a decision is made? Leaving these rules to one person’s memory means errors as the account grows.
With Ad Venture One: reporting, analysis and autopilot
Ad Venture One, the ad management and reporting platform developed by Ad Venture Digital, brings this cycle together on one screen. The Creative Performance screen shows the spend, conversions and conversion value of every creative on Meta and Google in the same table, and compares each creative with the account average to sort it into four decision buckets:
- Scale: Creatives delivering clearly above average, ready to be grown.
- Fatigued: Creatives that worked well for a while but whose performance has started to drop.
- Watch: Creatives that have not yet built up enough data for a decision.
- Review: Creatives that are far below average and still spending budget.
The metric is chosen according to the brand’s business: ROAS in e-commerce, cost per install for apps, cost per conversion for brands collecting forms. The screen also gives two important figures: recoverable budget, i.e. the spend of creatives that are still live while delivering far below average; and scaling potential, i.e. how much the winners are spending today. Scaling potential is deliberately capped at the winners’ current spend; no growth is promised without evidence. Click-through rate is also calculated on link clicks, as in Ads Manager, so it speaks the same language as the platform.
The comparison screens put campaigns side by side by period and by channel: spend, revenue and ROAS in the same table, with ratios calculated from period totals rather than daily averages.
Putting it on autopilot
Analysis only goes so far. The real gain lies in applying these decisions consistently every day. Ad Venture One’s autopilot reads Creative Performance and campaign data every day and generates recommendations: shifting budget to winning creatives, pausing those far below average, updating campaign budgets and target values.
The most important principle here is that control stays with you. Every change the autopilot generates is first prepared as a draft, and nothing changes on the ad platform until a person approves it. The autopilot feed clearly shows what was recommended, what was put on hold and why; the monitoring screen also keeps today versus yesterday, budget movements and the decision log together for each autopilot campaign. In other words, the system does the tiring part of the work and the expert team makes the final call.
The result: a system that knows every day what your creative delivers in each placement, steers the budget accordingly, and does it with your rules and your approval. If you would like to talk about how Ad Venture Digital can set up this cycle for your brand, we can start by looking at your current accounts together.
Let’s talk about this for your brand.
Write to us →