
We've Moved to GA4: How Should the "Conversion Path" Report Be Read Now?
Since the move to GA4, this table no longer appears in exactly the same form. But the data hasn't disappeared; only the measurement model and the way we interpret it have changed.
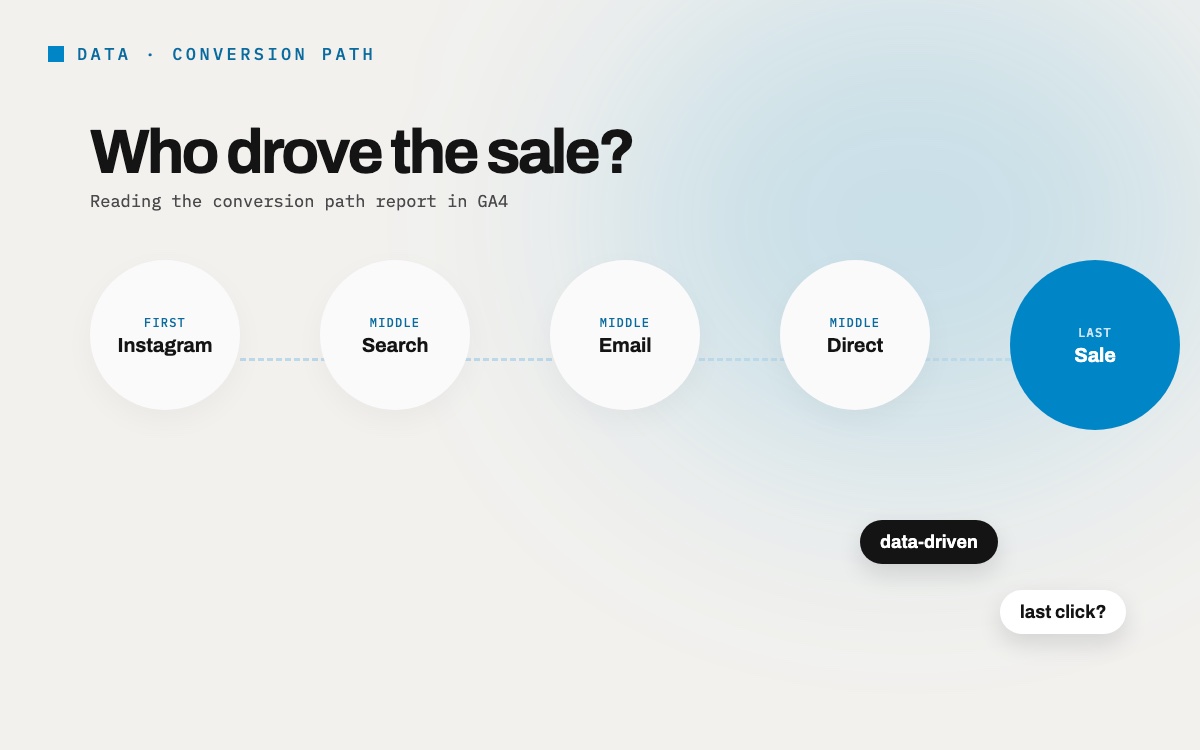
In the Universal Analytics (UA) era, the Conversion Path report was the go-to tool for analyzing users' interactions before a conversion.
Which channels the user passed through, who was influential along the conversion path, who got the last click: it was all visible in a single table.
This table was valuable for evaluating marketing investments because it gave a clear answer to the question "where did the conversion come from?"
Since the move to GA4, this table no longer appears in exactly the same form. But the data hasn't disappeared; only the measurement model and the way we interpret it have changed.
What Was the Logic in Universal Analytics?
UA was a session-based system. Each session started from a traffic source, the user interacted with the site, and if a conversion happened, that session was added to the conversion path. This way, the channels a user passed through before converting were listed in order, for example:
Organic Search → Paid Search → Direct → Conversion
This structure was quite intuitive but limited. Cross-device journeys, long time gaps or multiple touchpoints could not be fully accounted for. More often than not, the last-click model took center stage and the contribution of other channels became invisible.
How Has the Logic Changed in GA4?
GA4 moved to an event-based data structure. In other words, every user interaction is now recorded as an event. This brings an analysis mindset focused on "what did the user do, which events did they trigger". Session and user dimensions haven't disappeared entirely, though; they have simply become supporting metrics.
In GA4, the "Conversion Path" concept now lives in the Advertising → Attribution → Attribution Paths report. You can still see the steps users take towards a conversion here, but the focus is now on channel contribution rather than sequence.
In most properties, GA4's default attribution model is Data-Driven Attribution. This model uses historical interaction data to statistically distribute the credit for a conversion across channels. However, some standard reports (such as Traffic Acquisition) still rely on the last-click model, so results can differ depending on the model used.
So How Should We Look at It Now?
In UA, the leading question was "Who won the conversion?" In GA4, the question that comes to the fore is "How much of a role did each channel play in this conversion?"
Instead of a step-by-step table like UA's, GA4 answers questions like these:
- Which channels were influential before the conversion?
- How much did each channel contribute to the conversion?
- On average, after how many days and how many interactions did the conversion happen?
So the Conversion Path should now be read not as a table of channel order but as a multi-touch contribution analysis. GA4 tries to measure real impact within the marketing mix by assigning a weight to every touchpoint in the journey.
What to Watch Out For
To read the "Attribution Paths" report in GA4 meaningfully, the following points are critical:
- Define the conversion you are analyzing clearly. In GA4, each "Key Event" (for example purchase, lead_submit) is tracked separately. If you don't select which conversion you are looking at, channel contribution can appear muddled.
- Watch the data volume. The Data-Driven Attribution model needs enough conversion and journey data to produce meaningful results. With too little data, the model can distribute credit incorrectly.
- Check your UTM parameters and source tags regularly. Missing or incorrect tags lump traffic under "Direct" and distort channel shares.
- Always factor in time. The "Days to key event" and "Touchpoints to key event" metrics are very valuable for understanding user behavior. Users usually convert not in a single session but after several days and interactions.
- Compare across models. GA4's "Model Comparison" report lets you look at the same data through different attribution models. The difference between "last click" and "data-driven" helps you understand which channel is truly effective.
- Don't forget GA4's limits. The lookback window is 30 days by default for most conversions, but it can be set to a maximum of 90 days. Interactions beyond this window are not included in attribution, so these limits need to be kept in mind when interpreting results.
The Perspective Has Changed, but the Goal Is the Same
In UA, the leading question was "Who won the conversion?" In GA4, the question that comes to the fore is "How much of a role did each channel play in this conversion?"
The Conversion Path still exists; it just speaks a different language now. Rather than a step-by-step path table, GA4 tries to give fairer credit to every stakeholder in the conversion process.
GA4 has given us a new perspective: we should now read the path to conversion not as the story of a single winner but as the story of channels working together.
Let’s talk about this for your brand.
Write to us →